7 Secrets For Tracking Multiple Bank Accounts In One Spreadsheet That Will Show You Spending Patterns You Never Knew Existed
I used to have five bank accounts.

#Checking at Chase. Savings at Ally. Business checking at a local credit union. A high-yield savings for emergency fund. And a joint account with my business partner.
Every month, I’d log into each one. Check balances. Try to remember what I’d spent where. Export a CSV if I felt ambitious. Then give up because combining them was too much work.
I thought I was organized. I wasn’t. I was just managing chaos across multiple tabs.
Then I consolidated everything into one Google Sheet. And I finally saw what I’d been missing.
I thought I was spending $200/month on coffee. Turns out it was $347 across all accounts. I thought my grocery spending was under control. Turns out I was buying groceries from three different stores, and the total was 40% higher than I realized.
The patterns were always there. I just couldn’t see them when my money lived in five different places.
Here are seven secrets that will help you consolidate your accounts and reveal spending patterns you never knew existed.

Secret 1: The Account Column Reveals Cross-Account Spending Patterns
Most people track accounts separately. That’s the problem.
When you combine all transactions into one sheet with an “Account” column, you can see spending patterns that span multiple accounts. This is where the magic happens.
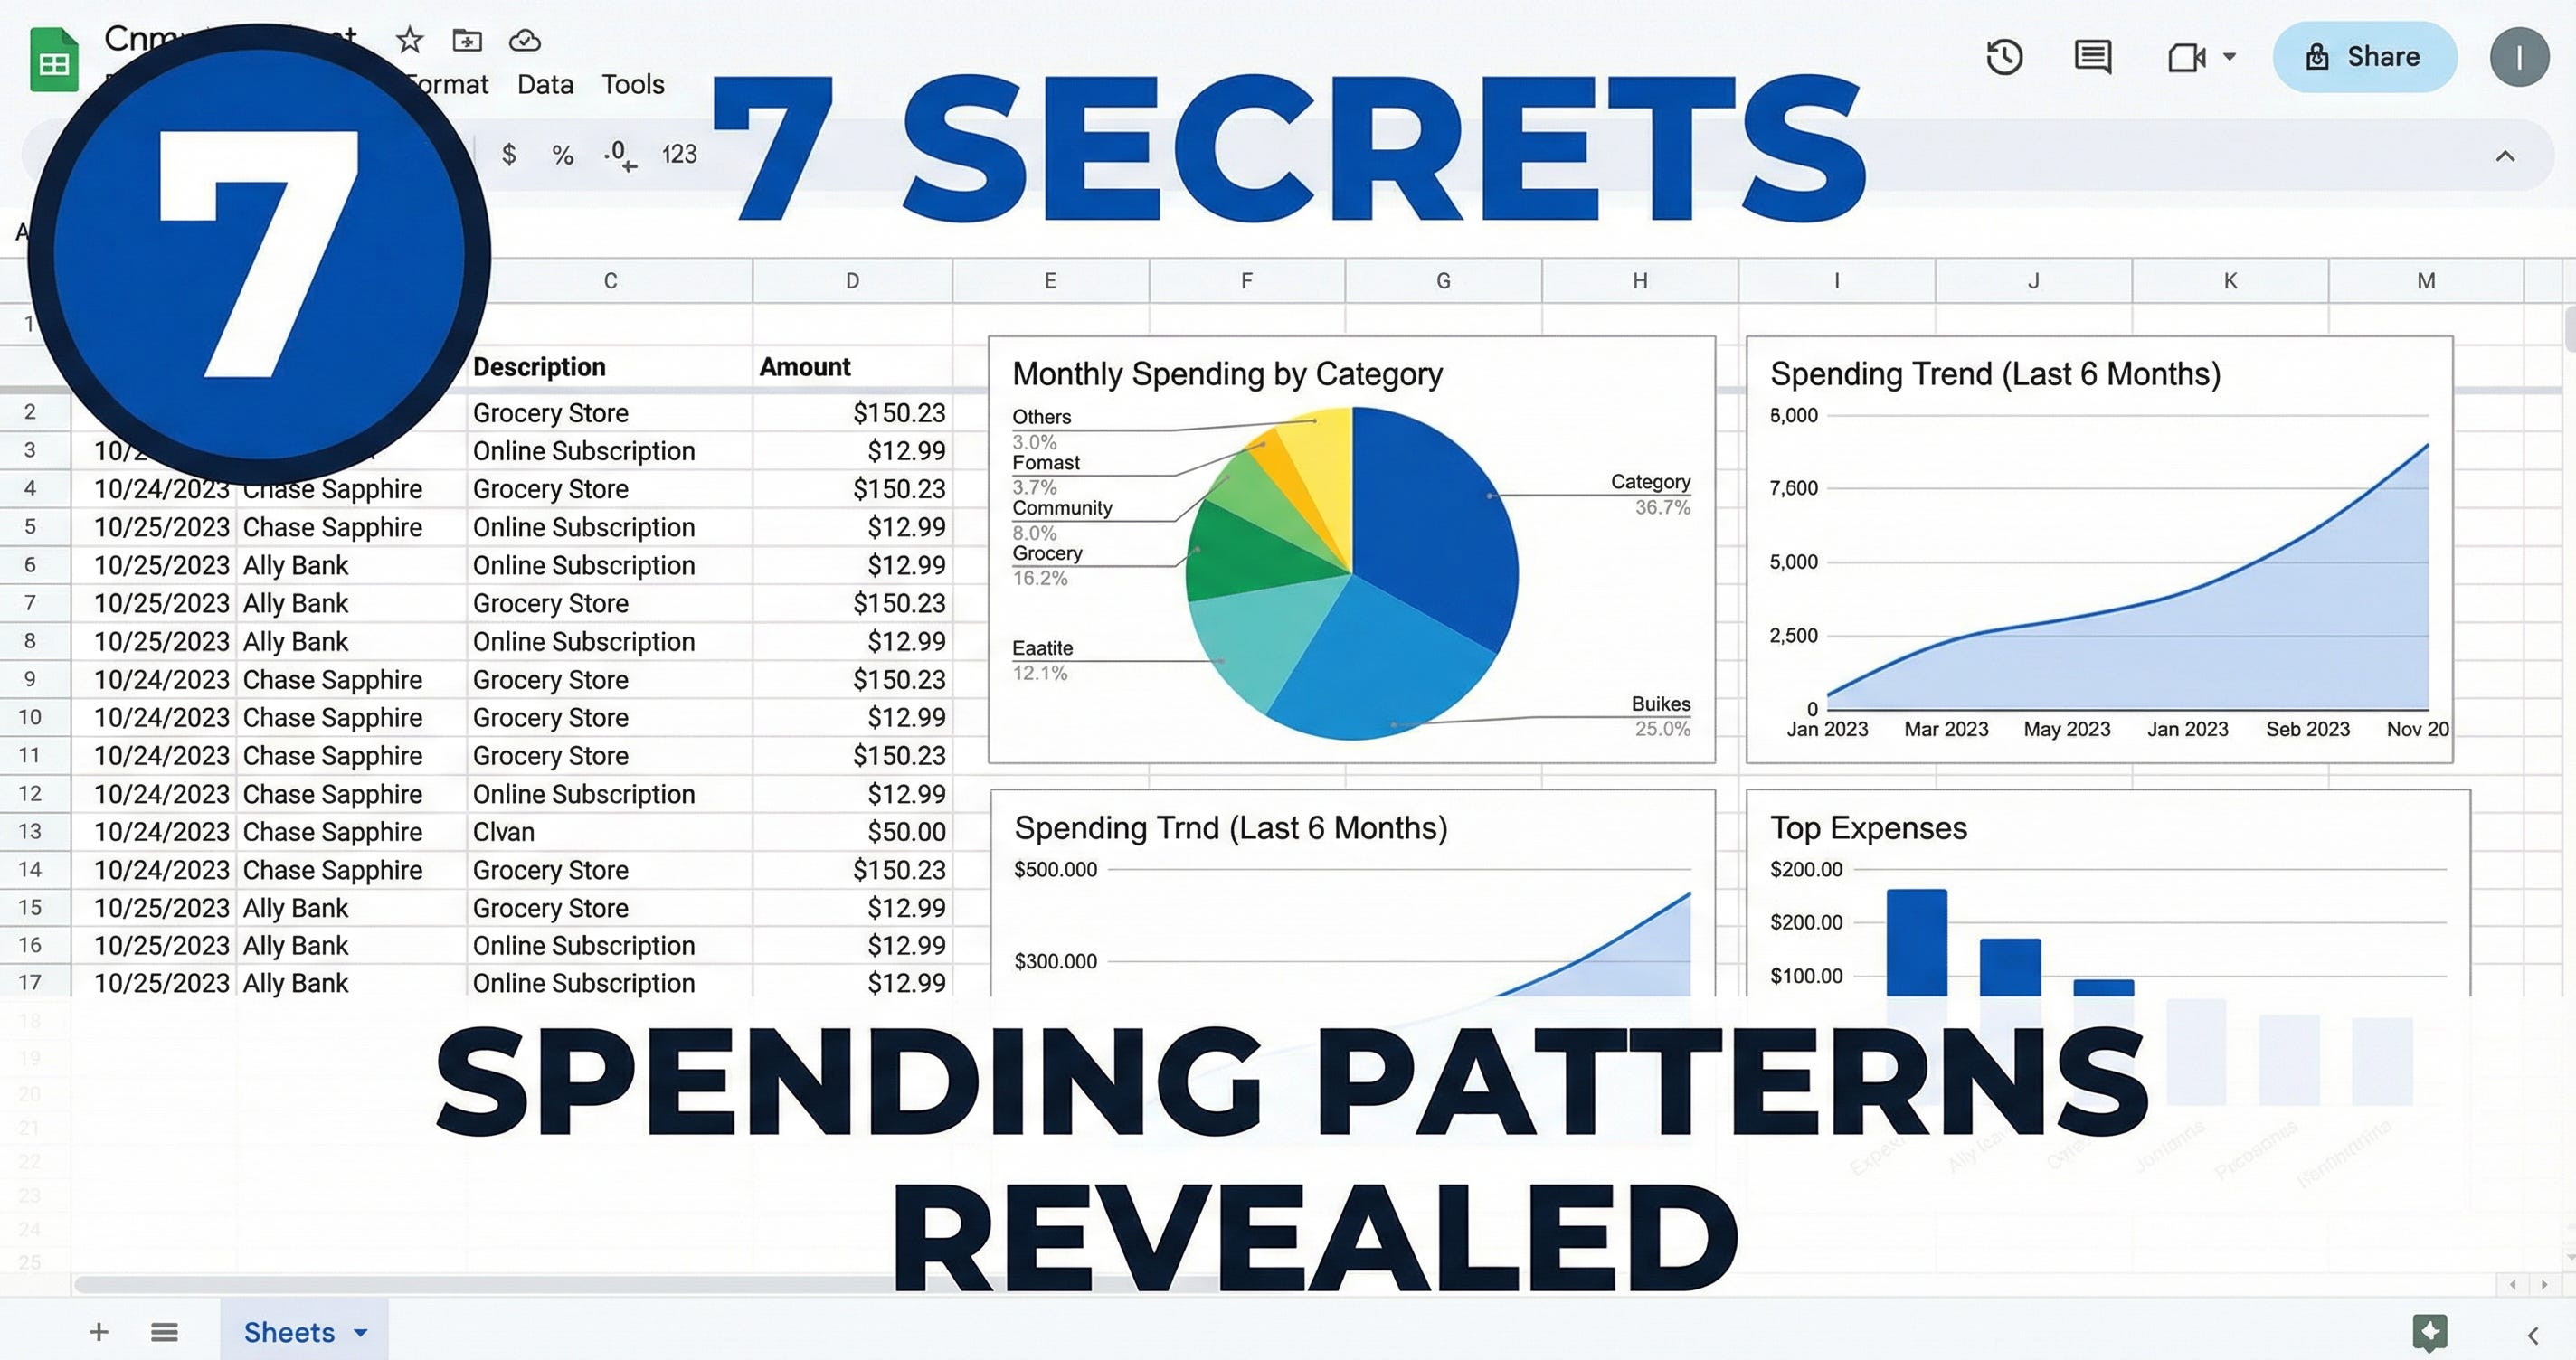
Here’s the setup: Create a master “Transactions” sheet with these columns:
- Date
- Account
- Description
- Amount
- Category
- Notes
The Account column is your secret weapon. Tag every transaction with its source account. Then use pivot tables to see spending by category across all accounts.
This reveals patterns like: “I thought I was spending $200/month on coffee. Turns out I was buying coffee from my Chase card, my business card, and my joint account. Total: $347/month.”
You can’t see this when accounts are separate. But when everything’s in one place with account tags, cross-account spending patterns become obvious.
Secret 2: Pivot Tables Show Spending Patterns Generic Apps Can’t
Generic budgeting apps show you their charts. Pivot tables let you build your own.
Here’s the secret: Once all your transactions are in one sheet, pivot tables reveal patterns you didn’t know existed.
Create a pivot table. Group by category. Sum the amounts. Filter by date range. Suddenly you see:
- Which categories are growing month over month
- Which accounts you spend the most from
- Which merchants appear across multiple accounts
- Spending patterns by day of week or time of month
The pattern I discovered: I was spending more on weekends, but only on certain categories. Food and entertainment spiked on weekends. Bills and subscriptions were consistent. I never would have seen this in Mint because Mint doesn’t let me build that view.
Pivot tables are free. They’re built into Google Sheets. And they reveal patterns generic apps can’t show because they’re limited to their own views.
Secret 3: Consistent Categories Reveal Hidden Spending
Most people categorize inconsistently. “Groceries” one time. “Food” another. “Supermarket” a third time.
The secret: Standardize your categories from day one. Create a “Categories” sheet with your master list. Use data validation to force consistency.
When categories are consistent, patterns emerge:
- You’ll see that “Dining Out” and “Groceries” are actually competing categories
- You’ll notice subscriptions hiding in “Miscellaneous”
- You’ll discover recurring charges you forgot about
I found three subscriptions I’d forgotten about because they were categorized inconsistently. One was “Netflix” (entertainment). One was “NETFLIX” (miscellaneous). One was “Netflix Subscription” (subscriptions). Same charge. Three different categories. Once I standardized, I saw the pattern.
Consistent categories reveal spending you didn’t know was happening.
Secret 4: Date Range Analysis Reveals Time-Based Patterns
Most people look at monthly totals. That misses the patterns.
The secret: Analyze spending by date ranges, day of week, and time of month. This reveals when you spend, not just how much.
Create columns for:
- Day of week (use WEEKDAY formula)
- Week of month (1-4)
- Month name
Then pivot by these dimensions. You’ll discover:
- You spend more in the first week of the month (bills)
- You spend more on weekends (leisure)
- You spend more at month-end (rushing to use budgets)
I discovered I was spending 60% more in the last week of the month. Why? I was rushing to use up budgets I thought I had. Once I saw this pattern, I changed my behavior.
Time-based analysis reveals spending rhythms you can’t see in monthly totals.
Secret 5: Standardized Merchant Names Reveal Duplicate Spending
Banks export merchant names inconsistently. “STARBUCKS STORE #1234” vs “Starbucks” vs “SBUX” vs “STARBUCKS COFFEE”.
The secret: Create a merchant mapping table. Standardize all merchant names to one format. Then you can see spending patterns by merchant across all accounts.
This reveals:
- Which merchants you visit most often
- How much you spend at each merchant per month
- Which merchants appear across multiple accounts
I discovered I was buying from the same five merchants across three different accounts. I thought I was diversifying my spending. Turns out I was just using different cards at the same places.
Standardized merchant names reveal spending concentration you can’t see with inconsistent naming.
Secret 6: Filter Out Transfers to See Real Spending Patterns
Transfers between accounts create noise. They show up as expenses in one account and income in another. They inflate your spending totals.
The secret: Create a “Transfer” category. Tag all transfers between your own accounts. Then filter them out when analyzing spending.
This reveals your actual spending patterns, not account movement.
When I filtered out transfers, I discovered:
- My actual spending was 30% lower than I thought
- I was moving money between accounts more than I realized
- My real spending patterns were more consistent than the raw numbers suggested
Filtering transfers reveals spending patterns that account movement obscures.
Secret 7: Monthly Updates Reveal Ongoing Patterns
Most people build the sheet, use it once, then forget about it. That misses the ongoing patterns.
The secret: Update monthly. Set a reminder. Make it a habit. The patterns reveal themselves over time, not in a single snapshot.
Monthly updates reveal:
- Spending trends (increasing or decreasing)
- Seasonal patterns (holiday spending, summer expenses)
- Account balance trends (which accounts are growing, which are shrinking)
- Category shifts (spending moving from one category to another)
I update on the first of every month. Takes 10 minutes. But over six months, I saw patterns I couldn’t see in a single month:
- My grocery spending was trending up (inflation)
- My entertainment spending was trending down (behavior change)
- My savings account was growing faster than I realized
Monthly updates reveal patterns that single-month analysis misses.
How to Set This Up
Here’s the practical setup that makes these secrets work:
**Step 1: Create Your Master Sheet**
Start with a “Transactions” sheet with these columns:
- Date
- Account
- Description
- Amount
- Category
- Notes
**Step 2: Import Your Data**
For each account, export transactions as CSV. Most banks let you do this. Some make it easy (Chase, Bank of America). Some make you dig through settings (smaller credit unions). But they all do it.
Import each CSV. Add the Account column if it’s not there. Standardize date formats (MM/DD/YYYY). Standardize amounts (negative for expenses, positive for income).
**Step 3: Create Supporting Sheets**
- **Accounts sheet:** List all accounts with types and balances
- **Categories sheet:** Your master category list (prevents inconsistencies)
- **Dashboard sheet:** Your pivot tables and charts
**Step 4: Build Your Pivot Tables**
Create pivot tables that group by:
- Category (to see spending by type)
- Account (to see spending by source)
- Date ranges (to see time-based patterns)
- Merchant (to see spending by location)
Filter, sort, and analyze. The patterns will emerge.
**Step 5: Set Up Monthly Updates**
Set a monthly reminder. Export new transactions. Paste them in. The sheet calculates everything automatically.
It takes 10 minutes per month. But the patterns reveal themselves over time.
Or automate it entirely. I built ZentroData to sync bank data to Google Sheets automatically. No manual exports. No CSV cleanup. Your data flows into your spreadsheet every day. The patterns stay current without the monthly maintenance.
If manual exports feel unsustainable, ZentroData handles the automation so you can focus on the analysis, not the data entry.
Reality Check
This isn’t for everyone.
If you’re happy with Mint or YNAB, keep using them. They work. They’re just not flexible enough for some people.
If you hate spreadsheets, this approach will frustrate you. It requires some comfort with data. Not advanced skills. But basic comfort.
If you only have one bank account, this is overkill. You don’t need consolidation if there’s nothing to consolidate.
And if you’re not willing to spend 10-15 minutes per month maintaining it, it won’t work. The sheet only helps if it’s current.
But if you have multiple accounts, want custom views, and can handle a spreadsheet, this changes everything.
Common Issues (And Why They Don’t Break the Patterns)
You’ll run into problems. Most are cosmetic. They don’t break the pattern analysis.
**Different date formats:** Standardize to one format. Use DATEVALUE if needed. The patterns still emerge.
**Duplicate transactions:** Tag transfers. Filter them out. Your spending patterns remain accurate.
**Inconsistent merchant names:** Create a mapping table. Standardize as you go. The patterns reveal themselves over time.
**Credit card vs checking:** Handle them the same way. A purchase is negative. A payment is positive. The patterns work across account types.
Don’t let perfect be the enemy of good. Get it working. The patterns will emerge even with minor inconsistencies.
The Tools You’ll Need
You don’t need much. Here’s what actually matters:
**Google Sheets** (or Excel). Free. Powerful. You probably already have it.
**CSV exports from each bank.** Every bank does this. Some make it easy. Some don’t. But they all do it.
**Pivot tables.** Built into Google Sheets. This is where the patterns reveal themselves.
**Automation (optional but recommended):** If manual exports feel unsustainable, ZentroData syncs bank data to Google Sheets automatically. It connects to all your accounts, imports transactions daily, and keeps your spreadsheet current without manual exports. This is what I built ZentroData for: to handle the data sync so you can focus on applying these seven secrets and discovering patterns.
The point is: start simple. Get it working manually. Apply the seven secrets. The patterns will reveal themselves. Then automate with ZentroData if you want to eliminate the monthly maintenance.
Final Thought
The spending patterns were always there. You just couldn’t see them when your money lived in multiple places.
These seven secrets help you consolidate everything into one spreadsheet. But more importantly, they help you see patterns you never knew existed.
Cross-account spending. Time-based rhythms. Merchant concentration. Category shifts. These patterns only reveal themselves when everything’s in one place, analyzed consistently, updated regularly.
Once you see these patterns, you can’t unsee them. And that changes how you think about money.
You stop guessing. You start knowing. You make better decisions because you have complete information. Not just about your accounts. About your behavior.
The setup takes a few hours. The maintenance takes minutes per month if you do it manually. Or zero minutes if you use ZentroData to automate the data sync. Either way, the patterns reveal themselves over time. And that’s where real financial control begins.
I built ZentroData because I got tired of manual CSV exports. Now my bank data flows into Google Sheets automatically, and I can focus on discovering patterns instead of managing data. If you want the same automation, ZentroData handles the sync so you can focus on the insights.
What spending patterns did you discover when you consolidated your accounts?